How to use GDB with VS Code
Updated 2020-11-04
👋 Introduction
Visual Studio Code (VS Code) is apparently very popular as a code editors. While it labels itself as only an editor, it has many features that enables it to be used like a proper integrated development environment (IDE). I will use CPEN 411 Lab 2 assignment as the sample project to guide the reader through this document. By the end of this document, we should know how to:
- Install C/C++ extensions for VS Code,
- Configure VSC to run the debugger, and
- Use the GDB debugger in VS Code GUI.
☑️ Requirements
First we must make sure that we have the tools to build/compile the source files (i.e. running make in the terminal should yield no errors).
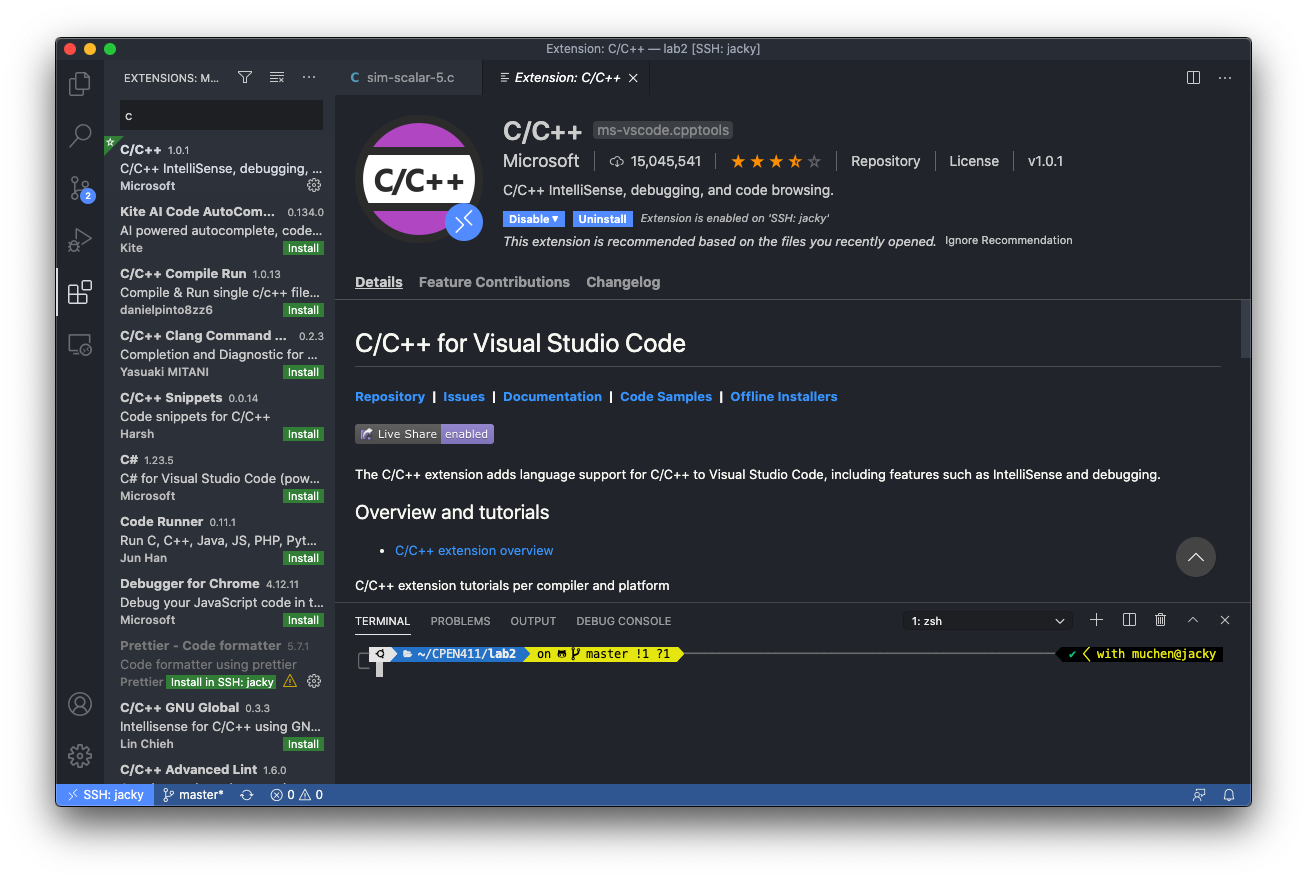
Then install C/C++ extension from VS Code Extensions Marketplace. Click the green Install button to install (Figure 1).
⚙️ Configure Launch
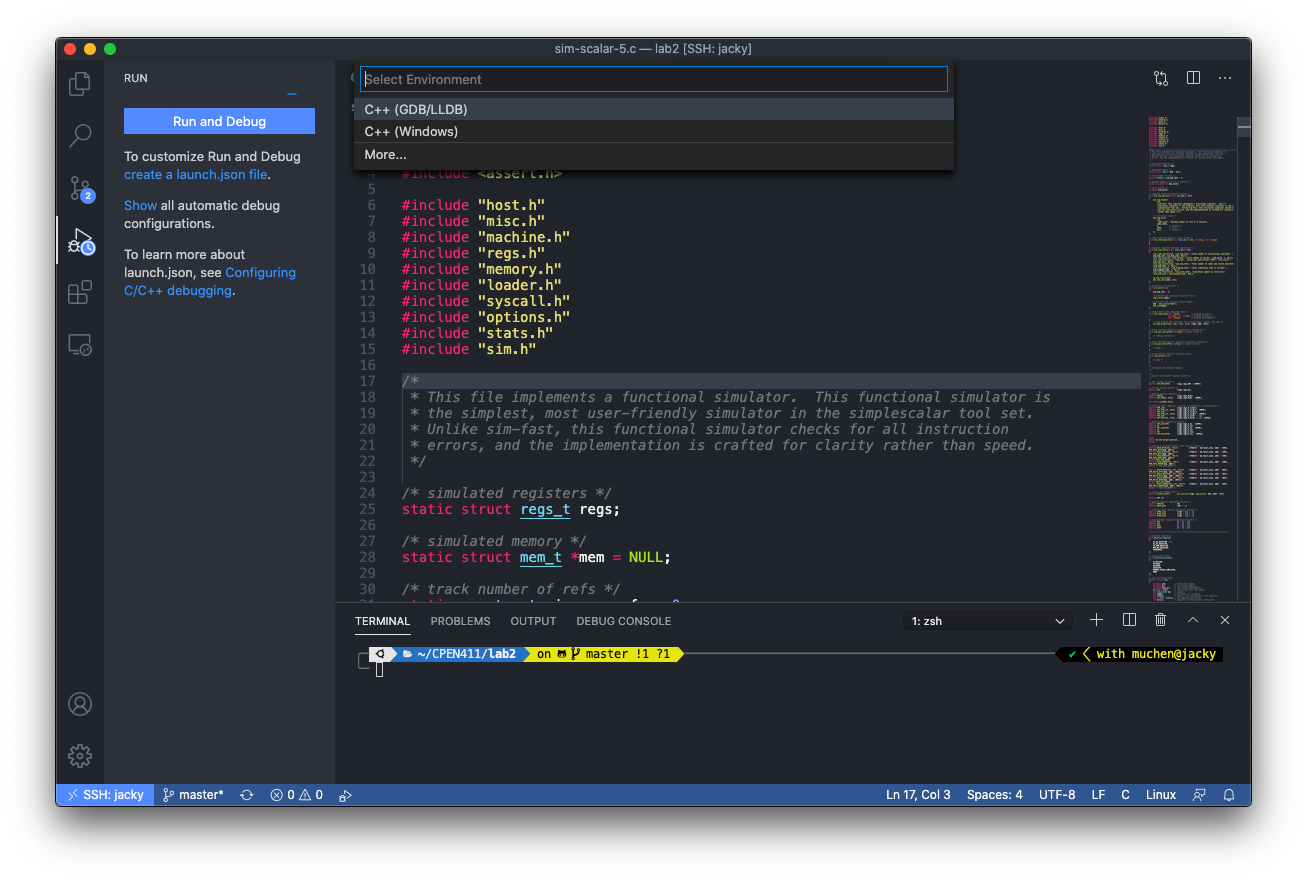
In VS Code interface, go to the Run tab in the sidebar (icon shaped like a bug overlaying a play-triangle). Then click on the big blue Run and Debug button. If the proper build tools are available, we should see something like in Figure 2. Type or select C++ (GDB/LLDB). You might then be prompted to select either gcc-7 or gcc, this doens’t matter so I chose gcc-7.
Upon completion, VS Code will immediately try to compile and run whichever file we have open in the active editor window. This will result in compilation error — which is expected. Click Abort. Now we see the active editor window showing the launch.json file as seen in Figure 3.
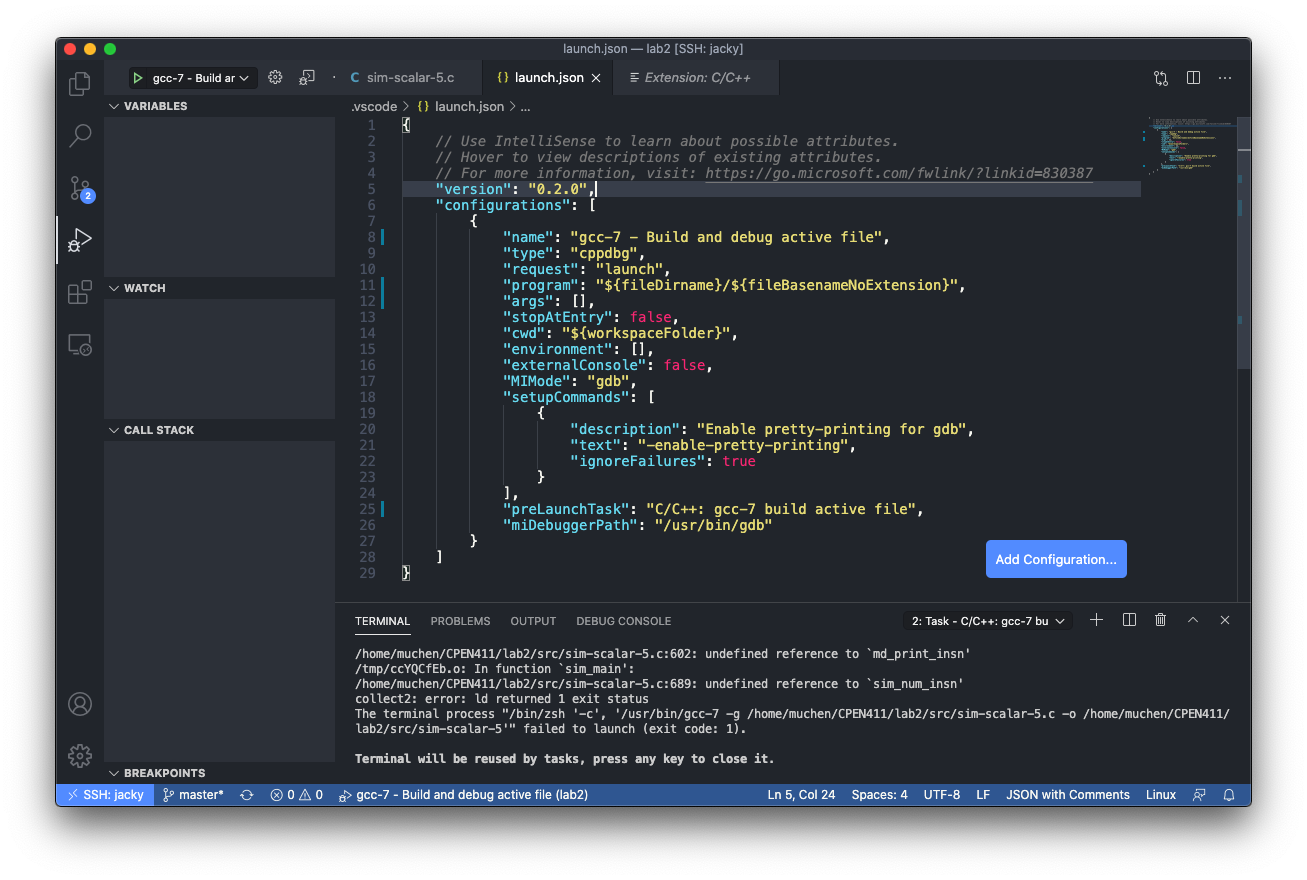
This file configures what happens when we “launch” from VS Code.
-
First let’s change the
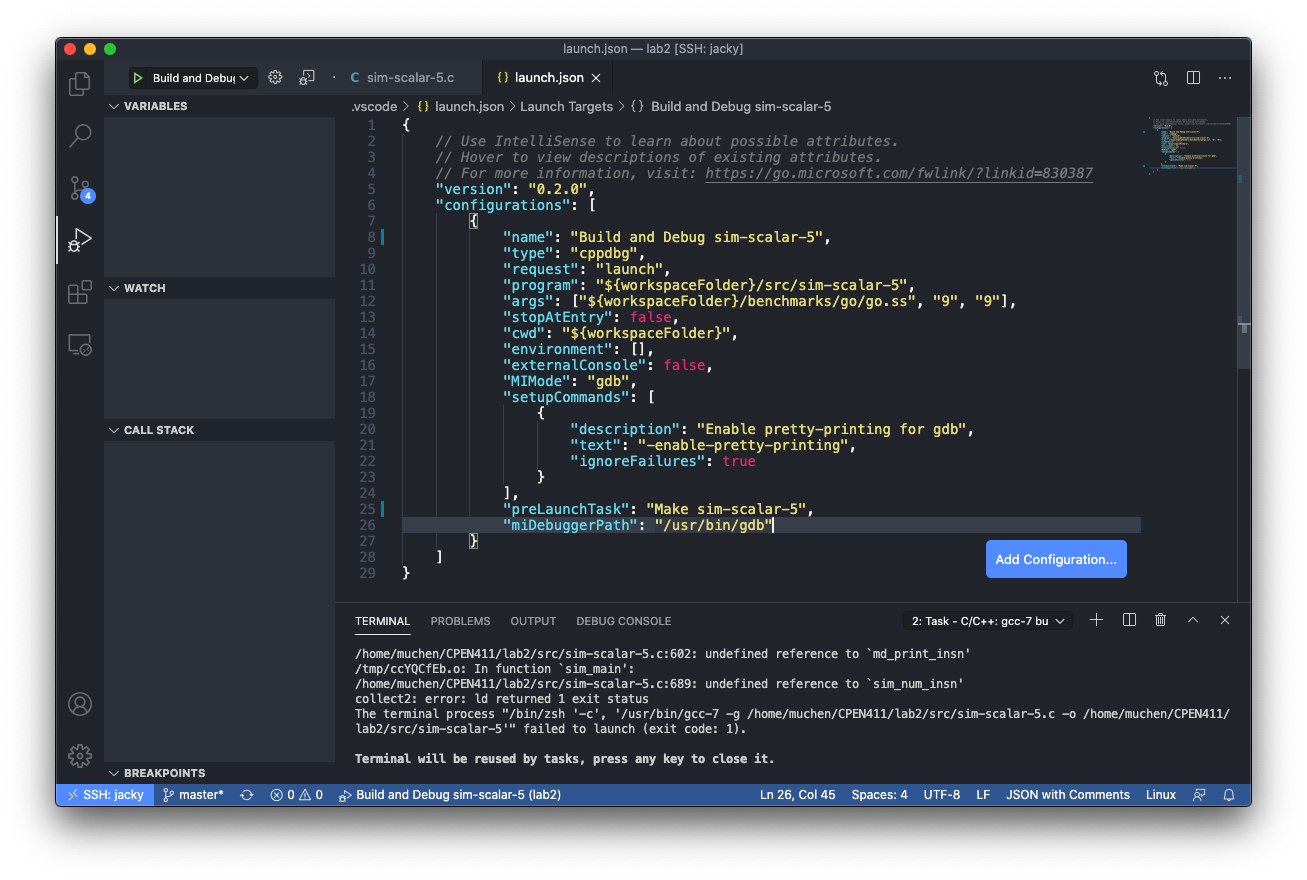
nameentry to something more relevant, such asBuild and debug sim-scalar-5. -
Change the
programentry to point to the path of the executable, in our case, this would be:“${workspaceFolder}/src/sim-scalar-5”. Note that ${workspaceFolder} is a VS Code special variable that expands to the root path of the workspace — in my case this is the root directory of the Lab 2 assignment. -
For
args, this will be the arguments passed into the simulator. For example, if we want to run the go benchmark, we would need to specify:"args": ["${workspaceFolder}/benchmarks/go/go.ss", "9", "9"]Note that the paths must be relative to the workspace root, and each argument are entered as separate strings in a list.
-
For the key
preLaunchTask, change the entry to some other name likeMake sim-scalar-5. Note that this is the name of the task that will execute before the launch happens. In the next subsection, we will go over how to make a build task that is responsible for runningmakeso that we have an executable program to launch from. -
Ensure that the path to launch
gdbis correct inmiDebuggerPath.
Once done, our launch.json file should look something like this (Figure 4):
Configure a Build Task
In this subsection, we will configure a task to run make.
-
Open the VS Code Command Palette, then select Tasks: Configure Task, then Create tasks.json from template, then Others. A new json file should open up.
-
Change
labelto the same string as what we set inpreLaunchTaskin launch.json — which isMake sim-scalar-5. -
Change
cmdto the command we want to run in the shell, which is to runmake:"command": "make -C ${workspaceFolder}/src"Note that here we use the flag
-Cto tell make to change directory to the src subdirectory.
Once we are done, it should look like Figure 5:
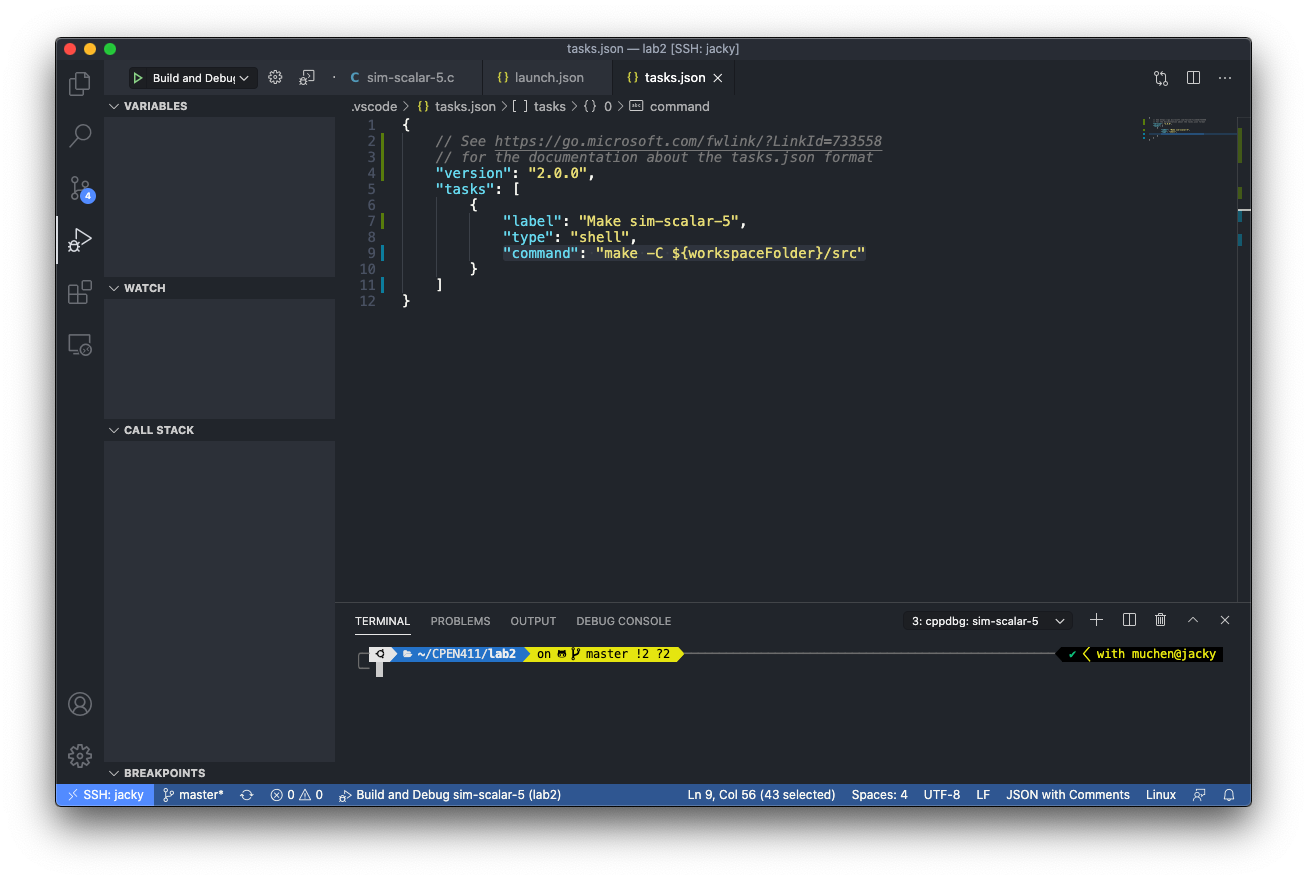
Makefile Compiler Flags
Since we’re debugging, let’s open up src/Makefile and make sure that no optimzation is set to be performed during the compilation. In the Makefile, sure that optimzation flags (OFLAGS) have -O0 for no optimization and -g to generate debug information:
OFLAGS = -O0 -g -Wall
🐛 Running and Debugging
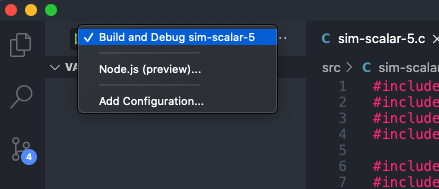
Once the steps described above is done, headback to our code (sim-scalar-5.c), go to the Run tab on the sidebar, and notice that we have a launch configuration ready to go (Figure 6):
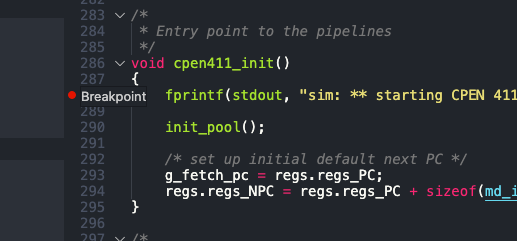
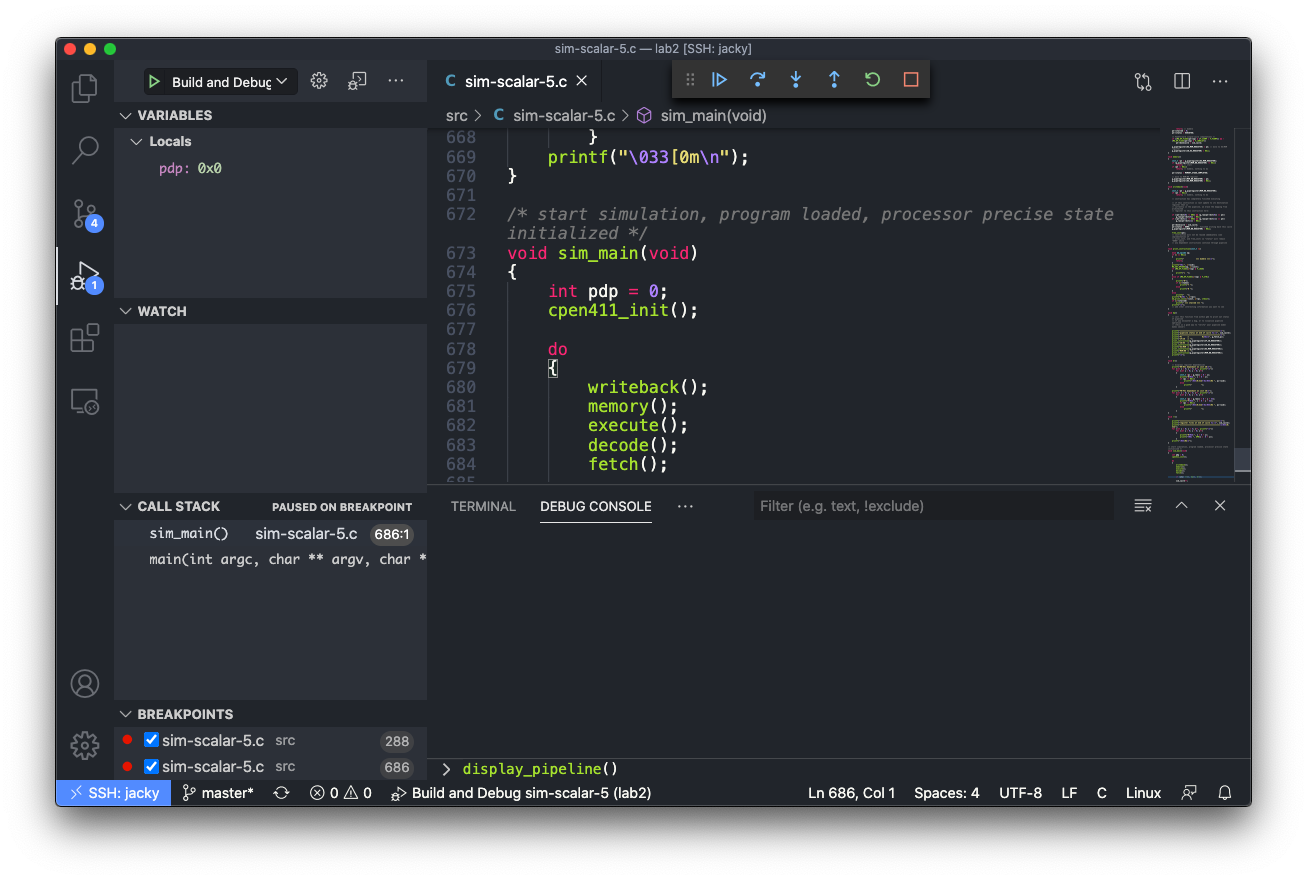
Adding Breakpoint
To add a breakpoint, simply click the left margin near the line number to add a red dot 🔴 symbolizing where the program should break out at as seen in Figure 7. This is equivalent of using break or b in GDB.
Start
Click the green triangle at the top of the Run and Debug panel or use the keyboard shortcut F5 to start debugging. From here on now, users of Visual Studio IDE would find debugging very familiar.
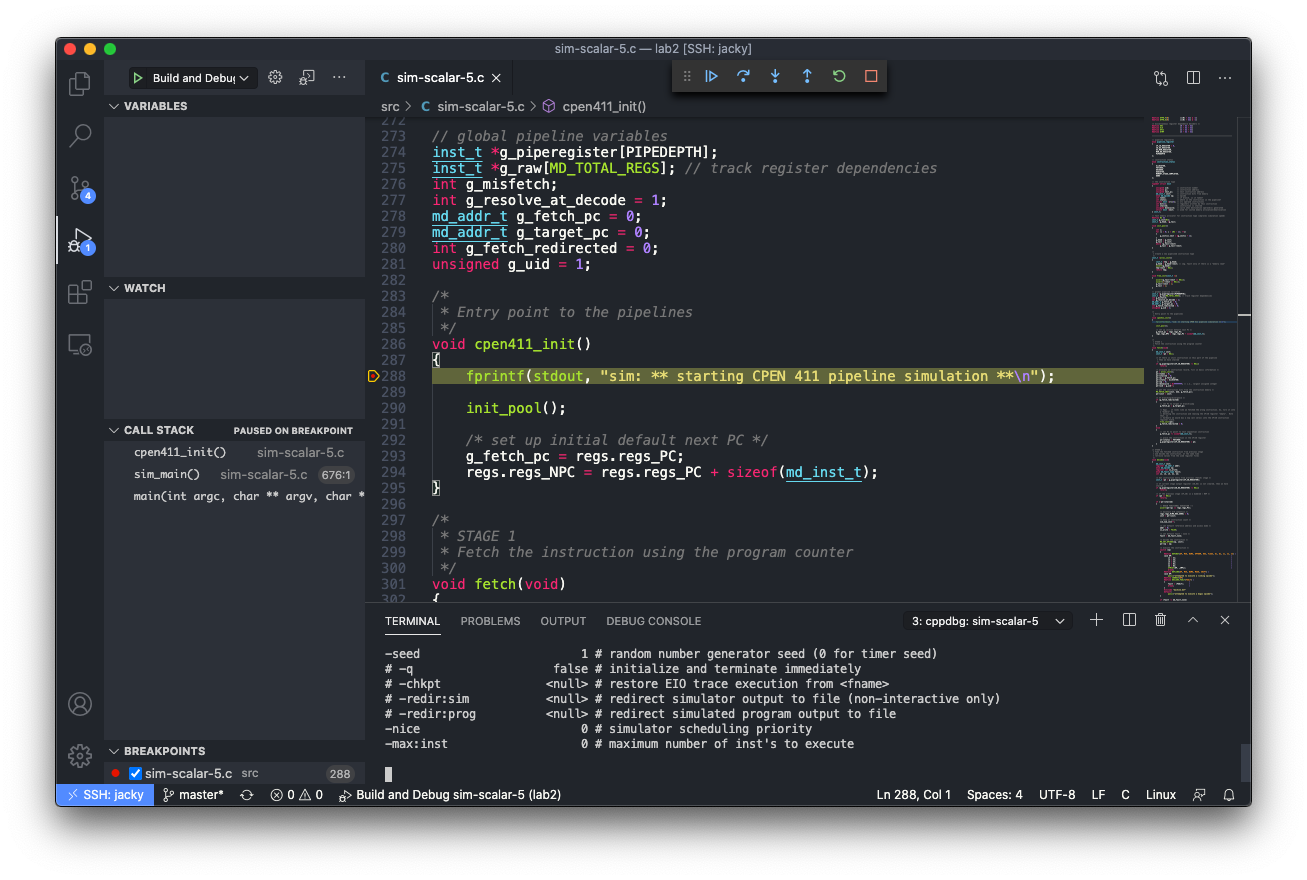
Stepping
As seen in Figure 8, we have paused at the line where we set the breakpoint. The toolbar at the top of the VS Code window provides controls to: continue, step over, step in, step out, restart, and stop the debugger. The lefthand Run and Debug panel shows local variables, watched variables, and the callstack.
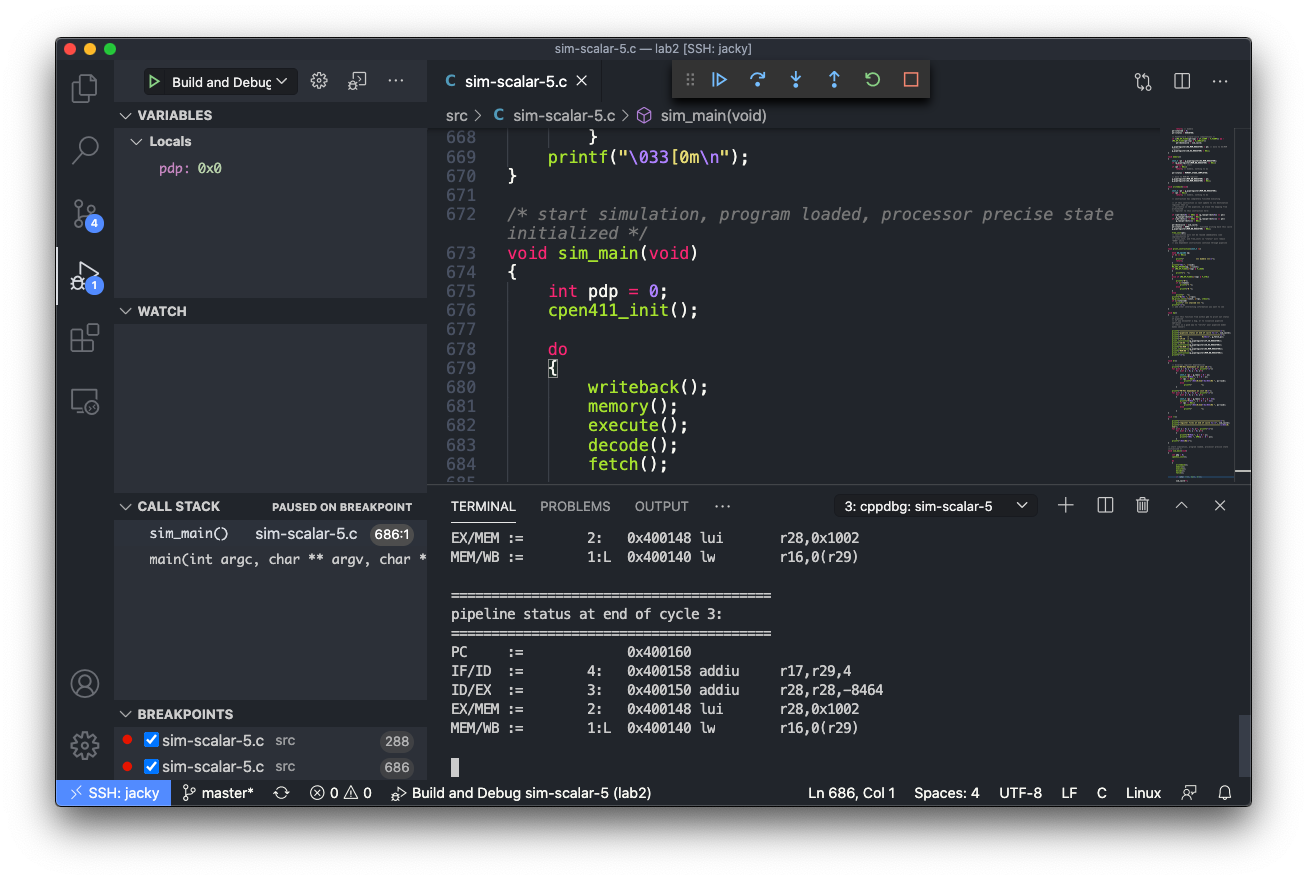
Debug Console
The Debug Console, shown as a tab in the bottom panel in Figure 9, can be used to enter commands for the debugger. For instance, we can call a function (Figure 9):
Then go back to the Terminal tab to see the resulting output of the function call (Figure 10):
👏 Conclusion
This concludes a short “tutorial” on how to configure VS Code to build a project from Makefile, running, and debugging the code. Using the VS Code debugger can potentially significantly speedup the workflow for someone like me — who’s grown up using visual/GUI applications and is more comfortable with it.
If there’s any questions or errors, please don’t hesitate to get in touch with me!