Muchen He :: 44638154
Midterm 2
Short Answers
Q1. Alternative A has an IRR of 14%. Alternative B has a base IRR of 21% and an Incremental IRR (B to A) of 13%. Alternative C has an IRR of 20%, an incremental IRR (C to B) of 16% and an incremental IRR (C to A) of 19% . If your MARR is 18%, which (if any) alternative should you pick?
Using incremental analysis, we first eliminate any options with IRR less than that of MARR (alternative A is unfit).
This leaves us with alternative B (21% base) and alternative C (20% base). We do incremental analyiss on that. The only incremental analysis data we are given is for C to B of 16%.
The incremental IRR for C to B is less than MARR, then we should choose option B.
Q2. What is the benefit to cost ratio of a highway project that will cost $2,000,000 in up front costs, require repaving every 10 years for $600,000, and has an estimated annual benefit of $200,000? Use an interest rate of 4% for the calculation. Assume the highway will last forever.
Because we assume there is infinite lifetime, we can calculate EUAC and EUAB to get our ratio.
A ratio of 0.897 is less than 1; it would be unwise to do this project.
Q3. An asset is purchased for $355,000. It is in a CCA Class that has a depreciation rate of 20% per year. What is the amount depreciated in the second year of owning the asset? What is the book value of the asset at the end of the second year? (the 1⁄2 year rule is in effect for this question).
In the first year, the added UCC is half of the cost basis, which is $177,500. The rate is , so the CCA is . The UCC balance at the end of year 1 is $177,500 subcracting CCA, which gives us $142,000.
Second year, the added UCC is the remaining half, which is also $177,500. The available UCC is now $319,500. Still at 20%, the CCA is $63,900. The book value / UCC balance at the end of second year is therefore $255,600.
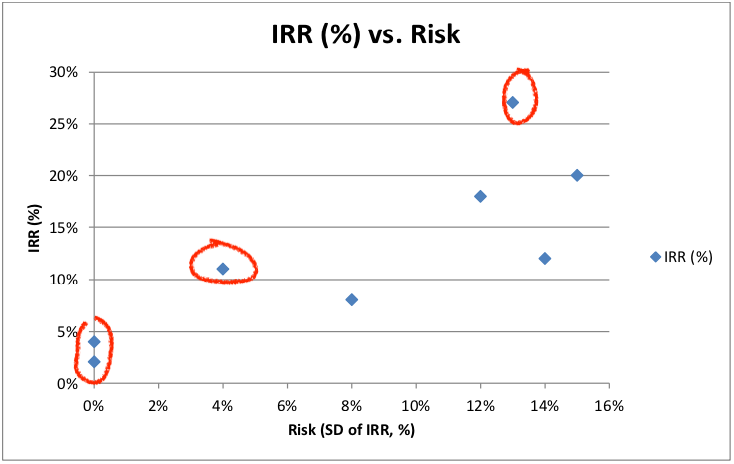
Q4. The chart below shows the rate of return for a number of proposed projects vs. their risk, measured in standard deviations. Circle or clearly identify the projects you believe are worth considering based on their risk vs. return.
Q5. You earn $74,000 per year. You pay a combined federal and provincial tax rate of 20.05% on the first $39,500 of income, and a combined tax rate of 28% on the next $39,500. What is your average tax rate?
The tax amount for the first half is
The tax amonut for the second half is
The total tax paid is $18,979.75. This gives us the average tax rate of 25.65%.
Q6. This year your business had the following revenues and expenses. Determine your business’s net profit and net cashflow from operations. Your business’s income tax rate is 26%.
| Operating Revenue | $780,000 |
| Operating Costs | $574,000 |
| Depreciation Expenses | $59,500 |
| Interest on Loan | $12,000 |
| Dividends to Owner | $20,750 |
The before-tax cash flow (BTCF) is operating revenue - operating cost:
The taxable income is BFCT minus the interest paid and the deprecation expense.
The income tax is based on a rate of 26%, thus the income tax amount is
The net profit is the taxable income subtracting the taxed amount which is
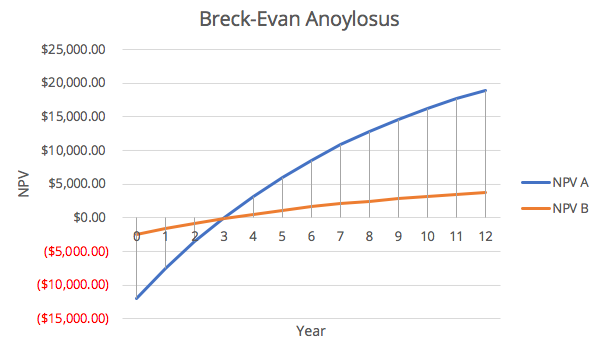
Q7. You are considering two options for expanding your production line. Option A is a new machine to de-bottleneck, and will cost $12,000, with $5000 in annual benefits. Option B is a process tweak to improve yields. It costs only $2,500, but yields $1,000 in annual benefits. If your internal interest rate is 12%, what is the break-even point of these options (to the nearest year)?
The NPV for either option for any given period (years) is given as:
Where is the annual benefit, is the present cost. We will use this in our break-even analysis. Using the year as our variable, we plot the following break-even diagram:
It can be seen graphically that the break-even point is 3 years.
Q8. Why is working capital not depreciated during a project?
Working capital refers to the costs immediately used to cover the time lag between selling an asset/product to getting the money.
They are not assets that can be depreciated because they do not provide value / benefit over time, they do not have a determined life time (because they're just money), and they do not wear out over time.
Q9. You decide to analyze a project using cases and joint probabilities. One variable you choose cases for is sales volume, with a high, nominal and low case. The second variable you use is product quality, reflecting warranty costs. You have two cases here, low warranty costs and high. To use joint probability, what assumption have you made about the relationship between these variables? Why might this be a poor assumption?
Joint probability assumes that the random variables are independent, meaning that the realization of one random variable should not affect the probability characteristics of the other.
However in this case, realistically, a better product quality would likely result in higher sales volume. Meaning that these two "random" variables are corrolated, and thus not independent. Therefore it is a poor assumption to say these are independent.
Long Answers
Q10. Discuss: what do depreciation expenses represent? How do depreciation expenses, which are book costs, affect the economic analysis of a potential investment in equipment? Why do we have different mathematical models for depreciation? Why is land not depreciable?
- Depreciation expense represents the allocation of the initial cost over the entire useful life time of the asset. This is to offset the initial cost for tax purposes.
- Depreciation are book costs, they affect hte economic analyis because they can potentially form tax shields which reduces taxes
- Different mathematical models exist because certain property/assets depreciate faster or have different characteristics. For example, electronics or computer technlogy depreciates very fast initially, but buildings or lasting furnitures would depreciate slower or linearly.
- Land is not depreciable because it has undetermined life time as it practically has unlimited lifetime. Which also implies that they're not property that wears out/become obsolute, or lose value ot the owner.
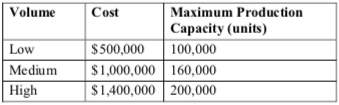
Q11. Widget’s Inc. is planning on investing in a new production line. It can invest in one of the three following systems:
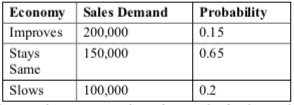
Expected sales volumes are dependent on how the general economy does.
Parts for the widgets are imported, so costs are dependent on the foreign exchange rate
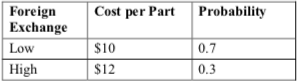
The sales price will be $20 per widget regardless of the economy and foreign exchange. The plan is to purchase the line and run it for three years, then shut it down – there will be no salvage value at the end of three years. Assume the economy and foreign exchange will be constant for all three years. If Widget’s Inc. has an MARR of 14%, determine the expected value of the Low volume line and the expected value of the Medium volume line. Note that a line may not produce more than its maximum capacity, even if sales demand is greater.
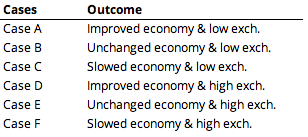
First, there are 6 cases of random outcomes. They are labeled as follows:
Low Volume
There are two random variables: expected sales and exchange rate. Normally the total number of joint outcomes would be 6. However because we can only supply 100,000 units, the economy is irrelevant (since the worst case of expected sales is at maximum production capacity).
So the there's only two outcome: exchange rate is high or exchange rate is low. The "joint probability" is the same as the independent probability (30% high and 70% low). We assume that we sell 100,000 units annually at $20, the cash flow for both cases are as follows.
Year Low exchange rate (70%) High exchange rate (30%) 0 $ (500,000.00) $ (500,000.00) 1 $ 1,000,000.00 $ 800,000.00 2 $ 1,000,000.00 $ 800,000.00 3 $ 1,000,000.00 $ 800,000.00 The NPV for respective outcomes are $1.822M and $1.357M. The expected value of NPV is:
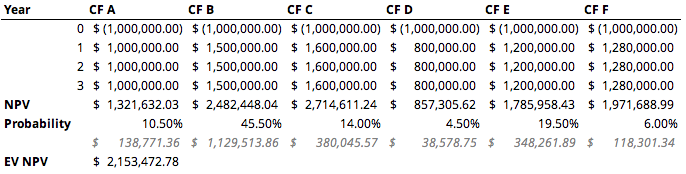
Medium Volume
For the medium volume case, if the economy improves, then we can only sell 160,000 units (reached full capacity). If ecnomy remains the same, we can sell 150,000 units (not reaching the full capacity). Lastly for slowed economy, we can only sell 100,000.
This time, we have all 6 outcomes. We compute the cash flow for three years for each case and find their NPV. The joint probability for each case is given by the product of independent probabilities. The work is as follows (in spreadsheet):
The expected value of NPV for medium volume is .
Q12. A manager at the company where you are employed has asked you to help choose one of three mutually exclusive investments. She proposes to accept the investment with either the lowest payback period or the highest benefit-cost ratio. Provide advice to the manager about what she has proposed and tell her how either or both of these criteria could be used to select the best alternative.
Investment with lowest payback period gives return on investment much quicker, the time value of money suggests that the faster obtained money is more valuable (in present value for example). This criteria should be chosen if the MARR is high.
Highest benefit-cost ratio investments gives the best "bang-for-the-buck". This criteria should be considered if the goal is to maximize profit over time. This criteria should not be considered if we want the lowest taxes.
There are scenarios in which highest benefit-cost ratio breaks even with lowest payback period. In this case, both can be considered.
A junior engineer you are mentoring approaches you to ask a question. She wants to understand how the business you both work in has shown a negative net profit for the last several years, but the cash balance of the company (the total cash in all its bank accounts) has grown steadily in that timeframe. Explain at least two ways how this could happen.
- Negative net profit could be accounting for the book cost of CCA which is the depreciation of assets that reduce taxes. But the actual cash flow is positive.
- The extra cash could be due to the tax credits
Q13. Your engineering firm provides consulting services for the automotive industry, testing parts for them. You want to expand into vibration testing, and are considering purchasing a shaker table.
You have two options for a table, but can only purchase one. After 10 years the table will be sold, as your lease in the building expires.
Your company’s tax rate is 19%, and the CCA rate for the tables is 25%. If you have an after-tax MARR of 15%, which table should you select?
Notes: The 1/2 year rule is in affect for these assets. If you end up with a negative taxable income in any period, treat it as we did in the lecture – consider it a refundable tax credit, and add the ‘negative’ income tax to your after tax cashflows.
| Medium Shaker Table | Large Shaker Table | |
|---|---|---|
| Cost | $290,000 | $420,000 |
| Annual revenue | $65,000 | $92,000 |
| Expected Salvage | $4,000 | $8,000 |
For this comparison/analysis, we will assume that negative taxes are refundable tax credit that is added to our yearly cashflow.
We also assume that the asset is purchased in present time (year 0). So the UCC account balance (book value) at the end of year 0 or at the start of year 1 is half of the cost basis.
The expense of both options are 0 so we omit it in our equation.
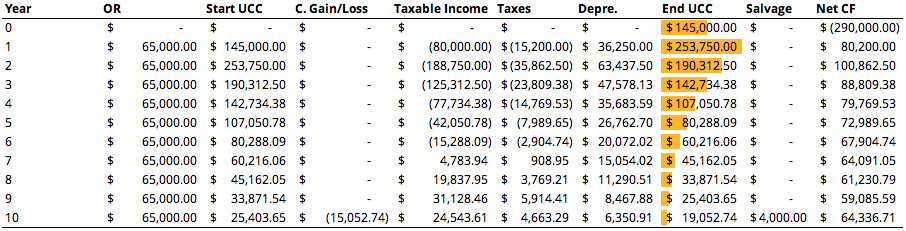
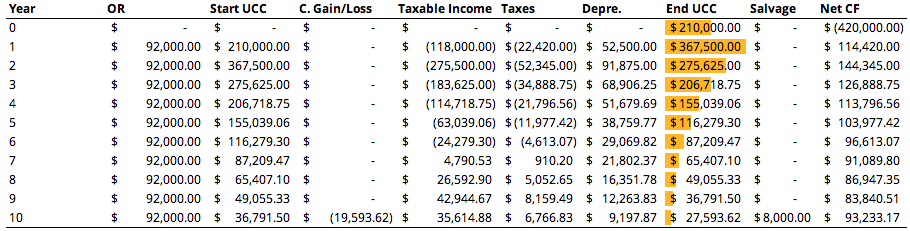
For the medium shaker, we get the following cash flow:
The
Start UCCof any year is given by theEnd UCCof the previous year. TheC. Gain/Lossis the capital gain or loss from salvaging assets. In this case, because we sold the asset much lower than its book value (End UCC), we get some tax reduction.The taxable income, in this case would just be the revenue (
OR) subtractingStart UCC.The UCC balance / book value is deprecaited by
Depre.which isStart UCCmultiplied with CCA rate of 25%.Finally, the net cashflow for that year (
Net CF) is theORsubtracting the paid taxes (Taxes).For the large shaker table, we do the same thing, except modified the initical cost of the asset, the annual operating revenue, and salvage value. Here is the cash flow:
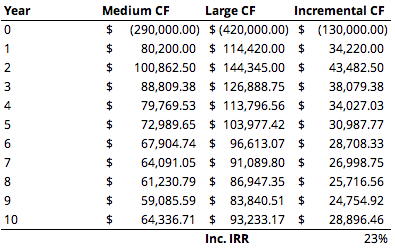
Now that we have the cash flow for both options, we can perform an incremented rate of return analysis. Taking the larger shaker table option as the higher costing one. Here is the incremental analysis:
The incremental IRR is greater than the MARR, therefore we should go with the larger shaker table option.
All spreadsheet work for this exam can be accessed here if ever needed.