Assignment 1Problem 10. Problem Description1. Payback Period of the ProjectFixed CostsVariable Costs2. Profit and Loss3. Marginal Profit and Loss4. Cashflow Diagram5. Average Costs, Revenue, and Profit / Loss6. One Year Payback Period
Assignment 1
Problem 1
Scrap work and attached excel sheet are included here.
0. Problem Description
You are working for a company that provides battery backup power systems designed for extended, low power operation. You currently build 10 per year, and this is the capacity of your current small-scale facilities. A customer has offered to purchase 50 units of your system, to be delivered in over the next year. These fifty units will have a purchase price of $40,000 per unit.
Currently we don’t have the capacity to deliver 50 units per year. The total revenue for 50 units is dollars.
The customer also wants an option to purchase 75 units per year for two years after the initial 50. Those additional units, if purchased, would have a price of $35,000 each.
We will need to expand production to allow for at least 75 units per year after the first year.
Your current facility has a capacity of 10 units per year, and you expect to continue to utilize that capacity to service other customers. It is approximately 2,000 square feet, and has the following annual costs:
- Leasing costs: $23,000 per year
- Insurance, tax, and utilities: 20% on top of base lease rate
In addition to 50 in first year and 75 in second year, there’s an additional 10 that needs to be produced. Total cost of current facility is .
The labor and materials cost for the latest system you built (the 40th in this facility), was $32,800. This has come down from an initial cost of $39,000.
Your production manager has been scouting some potential locations for a new facility, and the best candidate he has is a warehouse that will cost $140,000 per year for the base lease, plus 15% for taxes, insurance and utilities. However, the facility is significantly larger than you need, and he suggests a portion of it could be subleased out.
New facility total cost: .
He also estimates the new facility will require $580,000 in upgrades, equipment, and tooling to meet the 75 units per year in capacity. He also noted the industrial products index over the last four years was as follows:
- 2013: 135.3
- 2014: 136.8
- 2015: 137.2
- 2016: 139.9
Using current costing methods (i.e. do not account for interest, or the time value of money), is this project worth doing?
1. Payback Period of the Project
In the first year, we need at least 50 units for the customer and 10 units for other customers; 60 units in total. We need to utilize the new facility in order to reach our goal.
Fixed Costs
The new facility will cost a total of $741k including taxes, insurance, utilizes, and required upgrades in the first year. Since we are not at the full capacity at the new facility, we can temporarily suspend the old facility. This will still cost $27.6k.
Since we are not given more details of the new facility, we will assume worst case scenario and not sublet any portion of the new facility.
Variable Costs
According to various online sources 1 2 , a construction project tends to range between 25% labor and 75% materials to 40% labor and 60% materials. This varies a lot depending on the product (triangulation model). For the sake of simplicity we can assume that the given industrial products index also includes labor put in, so we can treat material and labor as one.
The decrease in cost for labor and materials used to produce one unit could be attributed to workers’ increase in performance. The value index from previous years could tell us how much material costs have changed.
The cost to build the unit is $39,000. Since it’s the first one ever built, the workers are working at the bottom of the learning curve. If we don’t consider worker increase in performance over time, then the cost of building a unit is given as:
Where are costs 4 years ago and now respectively, and ditto for cost indexes .
Then, we can assume that the cost reduction now is all due to increase in productivity and that the cost is directly proportional to time spent in labor. The difference in price is $40326-$32800=$7526. Using the learning curve model, we can write (noticed that we used the cost of the first unit after applying cost indexes):
The learning curve percentage is
The following table shows the the total cost of producing the 60 total required units this year, assuming current cost indexes, and accounting for learning curve on a per-unit basis:
| Unit # (year) | Unit # (all time) | Cost per unit ($) | |
|---|---|---|---|
| 0 | 40 | 32800.00 | |
| 1 | 41 | 31677.30 | |
| 2 | 42 | 31634.60 | |
| 3 | 43 | 31593.00 | |
| 4 | 44 | 31552.30 | |
| 5 | 45 | 31512.60 | |
| 59 | 99 | 30151.50 | |
| 60 | 100 | 30134.50 |
The total material and labor cost for producing 60 units this year is $1,847,310.
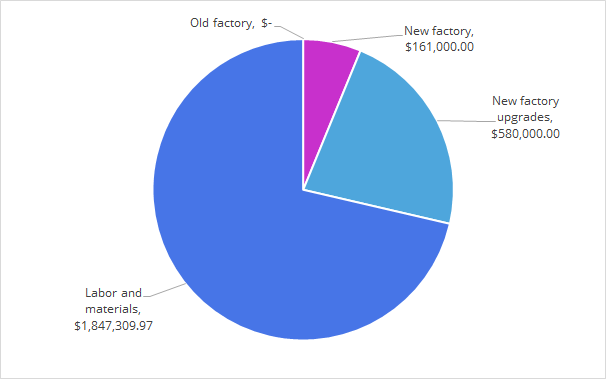
At the end of first year, we have 🔻 total costs of $2.59M and a 🔷total earnings of 60$40,000=$2.4M (assuming that income tax has already been factored out). We are operating at a loss in the first year. At the end we are $188.3k in debt. Cost breakdown chart:
In the second year, we continue the computation. Note that we are producing 75 units + 10 units so we are utilizing both the old and new facility. However, the equipment upgrade is no longer necessary. Also, we are selling the units at $35,000 per unit.
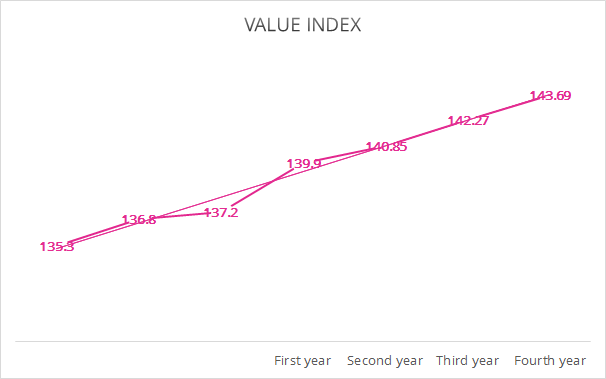
The total fixed costs is $118.6k, and the variable cost for producing total of 85 units is $2.5M, but for variable costs, we also need to take into account of the trend of increasing value index. As shown below, the estimated value index for the second year is 140.85. Thus the estimated variable cost for year 2 is $2.5M $2.53M.
Industrial production index / cost index / value index prediction:
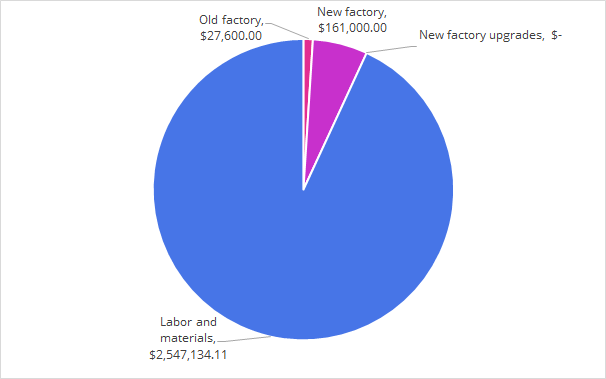
The total costs for year two breaks down is as shown in the pie chart below. The total cost is $2.72M, along with $188.3k debt from last year, our balance at this point is -$2.89M. The total revenue this year is 85 units $35,000 per unit which is $2.975M. The cost breakdown chart for year 2:
The revenue from year 2 paid off the loss in the first year as well as the second year. Therefore the payback period is 2 years. More specifically, the 71st model sold this year (or 171st unit of all time) would break even and make our balance positive.
2. Profit and Loss
The following chart shows the cost and revenue of estimation of three years of operations. The unit sold represents the number of units sold since the project began (doesn’t include the 40 produced historically). The breakeven point is shown as indicated. The pink region is the loss region. The blue region is the profit region.
Profit-Loss Chart:
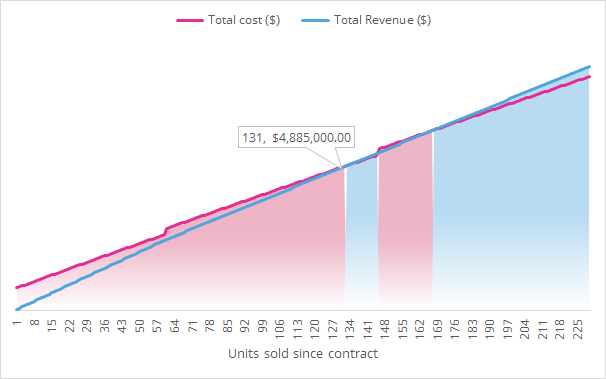
The total cost initially starts with a high offset due to high fix costs and non-recurring upgrade costs. The total revenue eventually pays off the total cost at 131st unit since contract (or 171st unit of all time).
Selling less units will result in operation in the loss region. Selling more will most likely land us in the profit region. Notice that shortly after we make even, the annual fixed cost of operation for the facilities causes total cost to increase, making a small secondary loss region. We have to make sure we sell more units after paying for these fixed costs to ensure profit region again.
3. Marginal Profit and Loss
In year 3, the cost of producing one more unit at the beginning of the year is $29,490, but as experience grows, the cost of producing one more unit at the end of the year is $28,852. Since we are selling each unit at $35,000 still, we have a average marginal profit of $5,561.
4. Cashflow Diagram
The following chart depicts the cash flow in the project for the first three years. Note that the minus sign (-) denotes expense / loss.
Cashflow diagram:
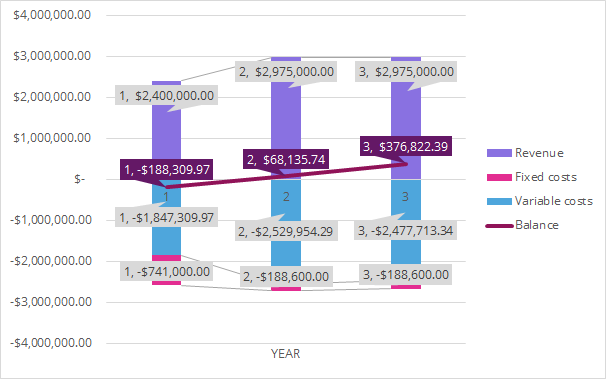
| Year | Fixed costs | Variable costs | Revenue | Balance |
|---|---|---|---|---|
| 1 | -$ 741,000.00 | -$ 1,847,309.97 | $ 2,400,000.00 | -$ 188,309.97 |
| 2 | -$ 188,600.00 | -$ 2,529,954.29 | $ 2,975,000.00 | $ 68,135.74 |
| 3 | -$ 188,600.00 | -$ 2,477,713.34 | $ 2,975,000.00 | $ 376,822.39 |
5. Average Costs, Revenue, and Profit / Loss
If all optional units are ordered (60 units in year 1, 85 units in year 2 and on wards), the average costs, revenue, and profit/loss is shown in the table below.
| Year | Average cost | Average revenue | Average profit/loss |
|---|---|---|---|
| 1 | -$ 43,138.50 | $ 40,000.00 | -$ 3,138.50 |
| 2 | -$ 31,982.99 | $ 35,000.00 | $ 3,017.01 |
| 3 | -$ 31,368.39 | $ 35,000.00 | $ 3,631.61 |
We can observe that if the entire project only lasted one year. We have average loss of $3.14k per unit.
6. One Year Payback Period
If we are only considering one year at most for the payback period of this project. One should not consider taking this project. Here are the reasons:
❌ Even though we haven’t considered subletting part of the new facility out. But consider that the loss of year 1 is $188k and the total annual fees is only $161k. It’s not possible to gain enough revenue from subletting part of the facility.
❌ Majority of the cost still comes from the variable cost to produce the units. One year is not enough time to produce enough units to reduce the cost due to the learning curve.
❌ The new facility’s non-occurring upgrade and equipment costs and fixed costs are too high for a single year.
Not part of my answer to the question, but it would be nice to consider alternative parameters to the project such that It may be more viable. One could choose to accept the project but proceed with caution only if the hypothetical conditions below were true:
⚠️ Upgraded tools and equipment can be sold at the end of year for at least the money lost, which is $188k.
⚠️ There is a likely hood of production streamline / innovation that causes the production cost per unit to lower drastically.
Overall, I think the recommendation is adequate. It provides a more conservative, but nonetheless semi-accurate estimate on the outcome of the project. Several models were used in the appropriate context to extrapolate the known data to give us the best judgement.